How to Read a Soil Test Report: 8 Steps From pH to Fertilizer Rates
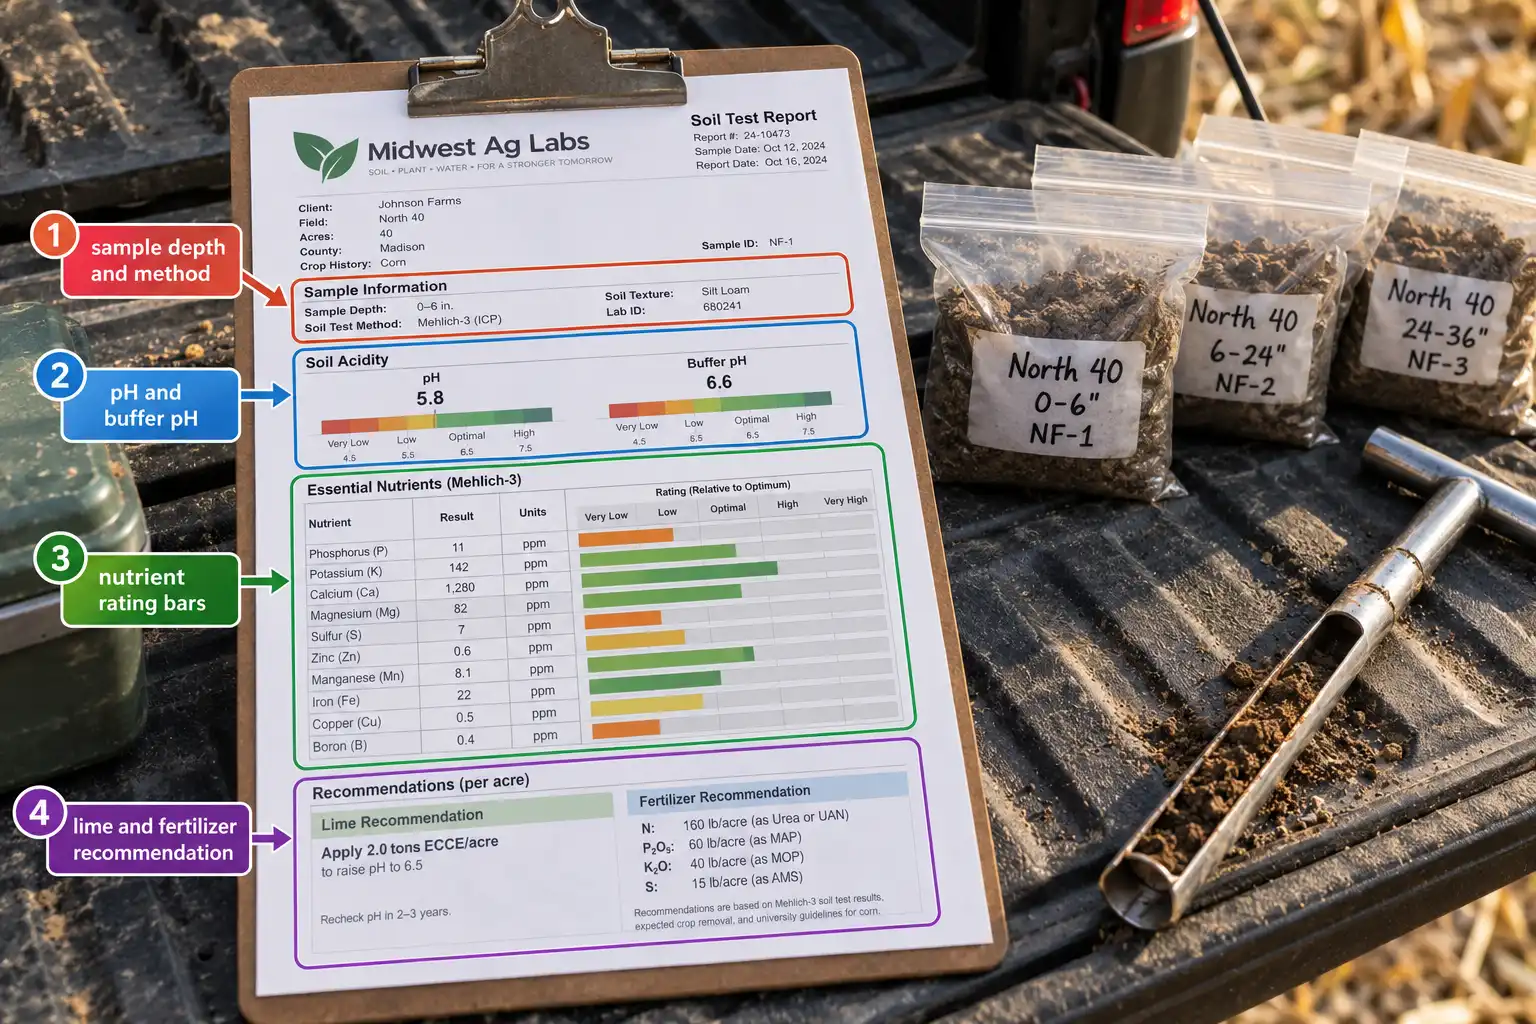
A soil test report fits pH, nutrient levels, ratings, and a fertilizer recommendation onto one page. Common misreads come from skipping the lab method or mixing up units. Below is how to read a soil test report line by line, then turn it into product rates.
To read a soil test report, confirm the sample depth and extraction method first. Next, pair pH with buffer pH to judge lime needs. Then compare phosphorus and potassium to the lab’s ratings and convert the recommendation into product pounds.
How to Read a Soil Test Report at a Glance
Most reports follow the same four-part layout, whatever the lab.
- Sample details: field name, sample depth, date, crop, and yield goal.
- Results: values such as pH, phosphorus, potassium, and organic matter, each with a unit and a test method.
- Ratings: a category from very low to very high, often drawn as a bar.
- Recommendations: lime and nutrient rates for the crop you listed.
Read the blocks in that order, since a wrong depth or crop throws off every line below it.
Step 1: Confirm the Sample Details and Lab Method
Start with sample depth, because each rating fits only the depth its trials used. Iowa State University Extension built its phosphorus and potassium ratings from 6-inch samples. K-State Research and Extension also uses a 6-inch sample for pH, phosphorus, and potassium. So send cores from that depth every time.
Next, find the test method beside each nutrient. Iowa State University Extension says labs should name the method, since tests extract different amounts of a nutrient. For example, an ICP reading of a Mehlich-3 extract shows more phosphorus than a colorimetric reading. Potassium results should also say whether the lab dried the sample or tested it moist.
Then check the crop and yield goal. The lab calculated its recommendation for them, so a wrong crop means a wrong rate.
Step 2: Read Soil pH and Buffer pH Together
Soil pH tells you whether to lime, and buffer pH tells you how much. Iowa State University Extension explains that soil pH measures active acidity in the soil water. Buffer pH, by contrast, estimates the reserve acidity held on clay and organic matter. Lime has to neutralize that reserve, so a lower buffer pH means more lime.
Two fields can share a pH and still need very different rates. In an Iowa State example, a clay loam and a sandy loam both test pH 5.6. Yet the clay loam’s buffer pH is 6.1, while the sandy loam’s is 6.8. So the clay loam needs far more lime.

Next, compare soil pH to your crop’s target. Iowa State University Extension sets 6.5 for corn and soybeans, or 6.0 where the subsoil is calcareous. Its alfalfa target is 6.9. K-State Research and Extension targets 6.0 for most crops in central and western Kansas, but 6.8 in southeast Kansas. The gap comes from subsoil acidity, not disagreement about the crop.
Finally, adjust the rate for your lime’s quality. Iowa State’s worked example calls for 2,100 pounds of pure calcium carbonate per acre. With lime rated at 63 percent ECCE (effective calcium carbonate equivalent), that becomes 3,300 pounds per acre. For no-till ground, K-State assumes lime works only 2 inches deep, so its rate drops to about one third.
Step 3: Read the Rating Before the Raw Value
The rating matters more than the raw number, because it shows how likely fertilizer is to raise yield. Iowa State University Extension defines its five categories that way.
| Rating | Chance fertilizer raises yield | What Iowa State suggests |
|---|---|---|
| Very low | About 80% | Build-up rate, for 2 years at most |
| Low | About 55% | Build-up rate, for 2 years at most |
| Optimum | About 25% | Replace what the crop removes |
| High | About 5% | Starter only, in some conditions |
| Very high | About 1% | None |
So an optimum rating does not mean “skip it.” It means about a one-in-four chance of a small gain, which is why Iowa State suggests a maintenance rate. In Iowa phosphorus trials, the average gain in the optimum category was about 4 bushels per acre.
Two reports can also disagree because labs follow different philosophies. K-State’s sufficiency program aims for 90 to 95 percent of maximum yield in the year you apply. Its build-maintenance program instead raises the soil test to a target over four to eight years, then replaces removal. Iowa State adds that growers can trim maintenance rates when prices are poor or land tenure is insecure.
Step 4: Match the Phosphorus Value to Its Test
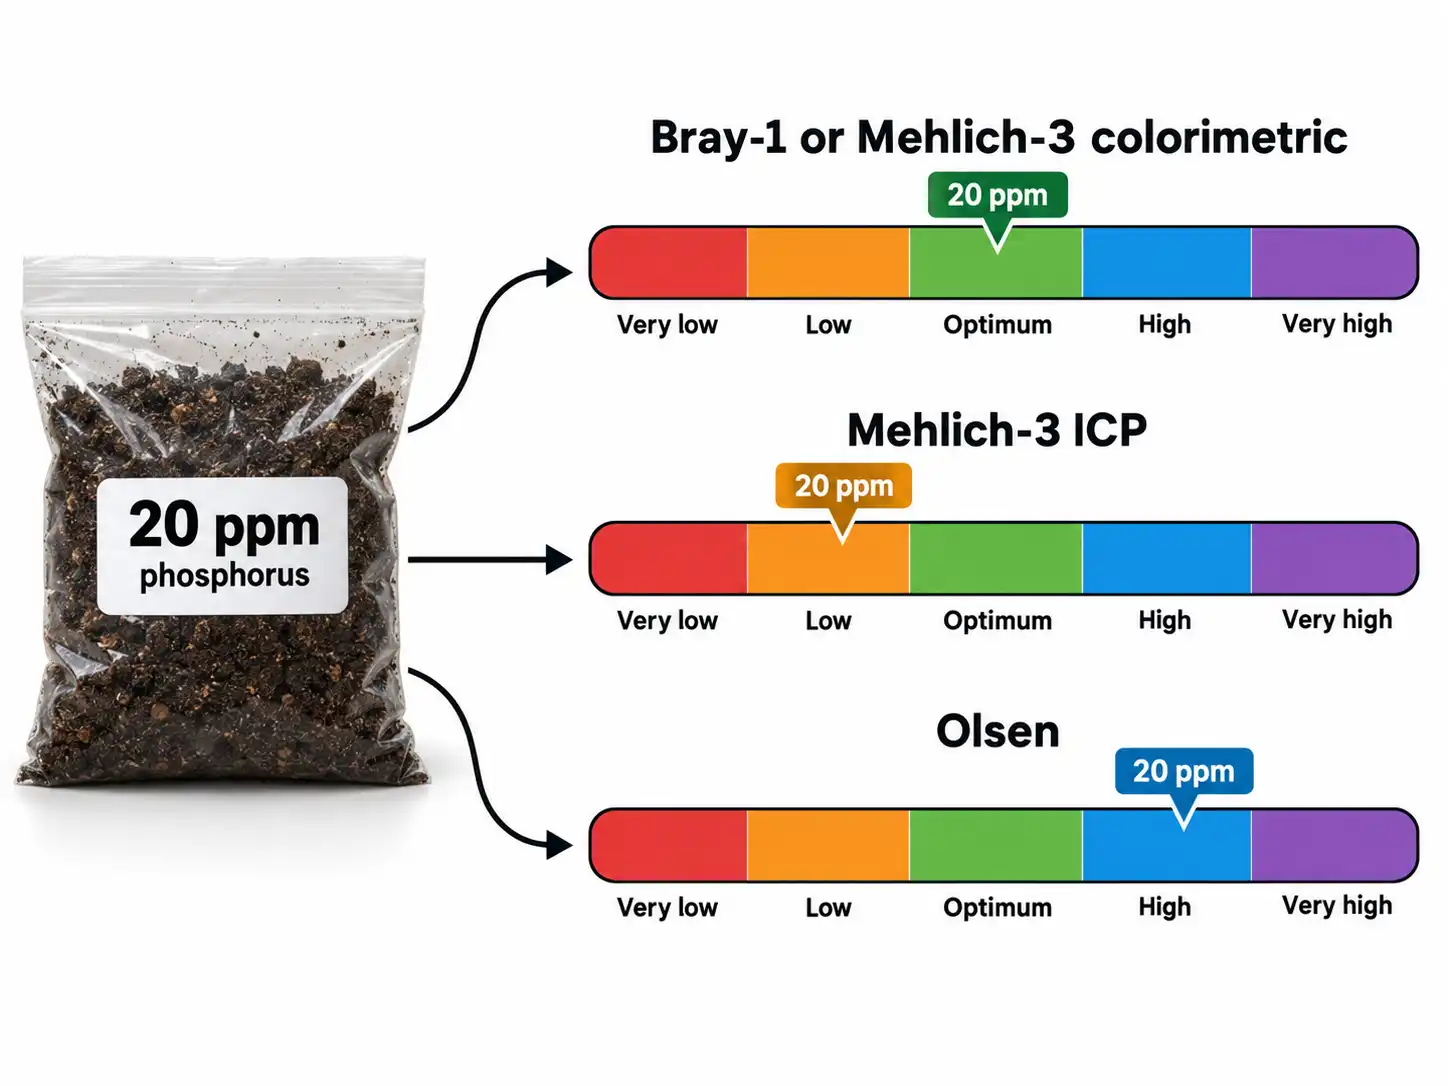
Read the phosphorus number only against the scale for its test. Each extraction method pulls a different share of soil phosphorus, so each has its own ratings. Iowa State University Extension publishes these optimum ranges for corn and soybeans:
| Phosphorus test on the report | Iowa State optimum range | What a 20 ppm reading means |
|---|---|---|
| Bray-1 | 18 to 25 ppm | Optimum |
| Mehlich-3, colorimetric | 18 to 25 ppm | Optimum |
| Mehlich-3, ICP | 28 to 40 ppm | Below optimum |
| Olsen | 11 to 15 ppm | Above optimum |
So the same number can call for fertilizer or for none. That is why the method line matters as much as the value.
Soil pH also decides which test fits. Iowa State advises against Bray-1 on calcareous soils at pH 7.3 or higher, and suggests Olsen or Mehlich-3 there. If your report gives Olsen P but your guide uses Mehlich-3 ratings, K-State multiplies the Olsen value by 1.6. For example, Olsen 15 ppm becomes 24 ppm on the Mehlich-3 scale.
On phosphorus, the major guides mostly agree. The Tri-State Fertilizer Recommendations for Indiana, Michigan, and Ohio put the corn and soybean critical level at 20 ppm Mehlich-3. K-State uses the same 20 ppm.
Step 5: Read Potassium With CEC and Organic Matter
Potassium ratings differ more from state to state than phosphorus ratings do. Each service calibrated its scale on its own soils, so use your state’s row rather than a midpoint.
| Guide | Region | Maintenance range for potassium |
|---|---|---|
| Iowa State, dried sample | Iowa | 171 to 220 ppm |
| K-State | Kansas | 130 to 160 ppm |
| Tri-State, CEC under 5 | Indiana, Michigan, Ohio | 100 to 130 ppm |
| Tri-State, CEC over 5 | Indiana, Michigan, Ohio | 120 to 170 ppm |
Below each range, the guide adds a build-up rate. Above it, the guide calls for little or none. So 140 ppm needs maintenance at most in Kansas or Ohio, yet rates low on Iowa State’s dried-sample scale. For moist or slurry samples, Iowa State’s optimum drops to 101 to 150 ppm.
CEC (cation exchange capacity) is why the Tri-State guide has two rows. It measures how much potassium, calcium, and magnesium the soil can hold, in meq/100 g. In Iowa State’s examples, a sandy loam sits near 5 and a clay loam near 20.
Organic matter, reported as a percent, feeds the nitrogen and sulfur math. For example, K-State credits 20 pounds of nitrogen per acre for each 1 percent organic matter for corn and sorghum. For wheat, the credit is 10 pounds.
Step 6: Check Calcium, Magnesium, Sulfur, and Micronutrients
Calcium and magnesium seldom need their own fertilizer when pH sits in range. The Tri-State guide says liming supplies enough of both. Likewise, Iowa State reports no evidence of magnesium deficiency in Iowa.
Base saturation is where reports split. Some consultants work toward ideal percentages, such as 2 to 5 percent potassium saturation. Iowa State research found potassium saturation a poor guide, and using that range would add unneeded fertilizer in many fields. So decide from the ppm ratings in Steps 4 and 5 instead.
Read the sulfur line with caution. The Tri-State guide says no accurate soil test for sulfur exists yet, so it recommends plant analysis instead. K-State, by contrast, builds a 24-inch sulfate sample and organic matter into its sulfur rate.
Most micronutrient lines need no action. K-State has not documented manganese, copper, or molybdenum deficiencies in Kansas, and it calls its boron test not well calibrated. Zinc is the exception for corn, sorghum, and soybeans. K-State recommends zinc when the DTPA test reads 1.0 ppm or less. Note the method, though, because Mehlich-3 extracts more zinc than DTPA, per Iowa State.
Step 7: Look for Nitrate and Salt Readings
Nitrate lines follow their own rules, because nitrate is mobile. K-State therefore samples nitrate to 24 inches, not 6. It converts the result with a simple formula: pounds of N per acre = 0.3 × sampling depth in inches × ppm nitrate-N. So 10 ppm across 24 inches credits 72 pounds per acre against the nitrogen rate.
For corn, Iowa State’s late-spring nitrate test samples the top foot when plants stand 6 to 12 inches tall. Results above about 25 ppm nitrate-N mean extra nitrogen is unlikely to raise yield. That makes the test a direct input to your sidedress nitrogen decision. Check the unit, too. The same sample reads about 4.4 times higher as nitrate than as nitrate-N.
Some reports also list EC (electrical conductivity), a measure of soluble salts. Here the method matters again. NDSU Extension notes that a saturated paste reads about 2.2 times higher than a 1:1 soil and water slurry. On the 1:1 scale, NDSU rates corn and soybean productivity low above 2 mmhos/cm, which equals 2 dS/m. Yield losses begin at 1:1 readings of 0.6 for soybeans, 1.0 for corn, and 3.0 for sugarbeets.
Step 8: Convert the Recommendation Into Pounds of Product
Recommendations list pounds of nutrient per acre, usually as P2O5 and K2O. Your soil values, however, are elemental ppm, as Iowa State points out. So never subtract one from the other. For reference, 1 pound of P equals 2.29 pounds of P2O5. One pound of K equals 1.2 pounds of K2O.
To get product weight, divide each nutrient rate by the product’s percentage. Take 200-bushel corn in the maintenance range in Indiana or Ohio. There, the Tri-State guide calls for 70 pounds of P2O5 and 60 pounds of K2O per acre.
- MAP (11-52-0): 70 ÷ 0.52 = about 135 pounds per acre. It also supplies about 15 pounds of nitrogen, so subtract that from your N plan.
- Potash (0-0-60): 60 ÷ 0.60 = 100 pounds per acre.
For smaller areas, divide the per-acre amount by 43.56 to get the rate per 1,000 square feet.
| Area | MAP (11-52-0) | Potash (0-0-60) |
|---|---|---|
| 1 acre | 135 lb | 100 lb |
| 1,000 sq ft | 3.1 lb | 2.3 lb |
| 100 ft of row, 30-inch spacing | 12.4 oz | 9.2 oz |
| 4 by 8 ft raised bed | 1.6 oz | 1.2 oz |

Common Mistakes When Reading Soil Test Results
These errors can turn a sound report into a wrong rate.
- Switching labs or tests. Iowa State notes that results still differ substantially among labs, despite proficiency testing. Track trends with one lab and one method.
- Changing the sampling routine. The Tri-State guide stresses sampling in a consistent way, with no more than 25 acres per sample.
- Inflating the yield goal. A higher goal raises nutrient rates. K-State suggests about 105 percent of the field’s average yield over the past 3 to 5 years.
- Treating one number as the whole field. Iowa State widened its optimum category partly because soil tests vary sharply over short distances.
FAQs About Reading a Soil Test Report
How do you convert ppm to pounds per acre?
Multiply ppm by 2, which assumes about 2 million pounds of soil in an acre’s top 6 to 7 inches. Purdue Extension, for example, lists a 20 ppm phosphorus level as 40 pounds per acre.
How often should you test soil?
Every 3 to 4 years works for corn, soybeans, wheat, and alfalfa, per the Tri-State guide. Sample the same way each time, with no more than 25 acres per sample, so results stay comparable.
Why did my soil test potassium drop since the last test?
Crop removal usually explains it: Purdue Extension estimates 1 ppm lost per 10 to 20 pounds of K2O removed. A new lab, depth, or dried versus moist handling can also shift results.
Do you need lime if soil pH is 6.2?
Yes for corn and soybeans on acidic subsoils, where Iowa State recommends lime below 6.5. Over calcareous subsoil, its cutoff is 6.0, and K-State’s cutoff for central and western Kansas is 5.8.
Should you follow the lab’s fertilizer recommendation?
Yes, if the lab bases its rates on your state’s land-grant ratings. If it does not, rerun the results through your state’s guide, since Iowa State, K-State, and Tri-State potassium ranges differ.
Putting This Into Practice
Match every value to its test method and your state’s guide before you act on it. The same ppm can rate low in one state and adequate in another. Convert P2O5 and K2O to product before you buy, then scale the rate to your acres or beds. Keep the next sample on the same depth, lab, and schedule. When a result looks odd, check it with your county extension office.